
Warning! Lots of maths in this one!
Return on Investment (or ROI), can be an emotive and confusing subject. Just what is it? And how does it compare to Gross Yield and Return on Capital Employed (ROCE)? Well there are lots of interpretations of it – and that’s the problem. I have had questions about this, so I may even make a video in future laying out exactly how we work it out.
But for now, I’ll explain how we calculate ROI and ROCE using a simple Buy-to-Let (BTL) test case. Our preferred measure is ROCE as it’s the return on your initial input, but I think ROI (how we do it anyway) describes in a more warts-and-all way exactly how the investment will act over time.
Caveat: I’m not going to cover tax, as that’s highly situational to individuals and I’m not qualified, but that would clearly have a negative impact once you made enough return to cover your initial revenue (non-capital) costs (e.g. costs like agent fees, mortgage interest (company) – not the initial deposit) costs.
I’ll go through Gross yield first as it’s simple, and many will already be familiar with it.
It should go without saying that this is not financial advice, it is simply me explaining my methodology – how I would do it. Also, it’s easy for me to get carried away with numbers as I’m very mathematically-minded – you have been warned…!
(Psst… we also post various things on Social Media daily, including completed projects. Follow us on Facebook here.)
Gross Yield. This one is extremely easy, it’s simply the monthly rent, multiplied out for the year, and divided by the purchase price.
So, for a £100,000 property renting at £1,000pcm, that’s 12%.
(£1,000 x 12) / £100,000 = 12%.
Do properties like this exist? Yes they do…
Gross yield is a rough indicator of a property’s performance in rental terms, and can be a good indicator in some cases that a particular property, or area in general, are undervalued – and may hint at more significant capital uplifts in the near to medium future (thereby reducing average yields again). But you’d need more information to make a solid conclusion about that. In general I wouldn’t look at anything less than about 12% Gross yield as a first consideration. Gross yield is a good first stab, but it’s rough, and doesn’t tell the full story. And of course, it goes without saying that the property needs to rent to get that yield! A common trap that many newbie investors fall into is basing their investments almost entirely on Gross yield, and therefore ending up with very cheap properties – that tend to get more problems in terms of repair costs and rent – making that good headline yield evaporate. Worse, they then have to buy with cash, and their returns fall even more because they aren’t using the leverage benefit from mortgages.
Return on Investment. Simply put, for us, it’s all the money that comes in from a property in year 1 (Gross Rent), divided by all the money that gets spent on a property in year 1. That’s EVERYTHING that’s spent. This way, it accounts in an all-encompassing way exactly how hard your investment is working for you. Lets do a conservative example with the same simple Buy to Let property from before, and then we’ll see what happens afterwards with a cash-only purchase – to compare how good each investment is.
Purchase Price: £100,000
(Bought with a standard 75% interest-only mortgage @ 5% interest rate.)
One-off/upfront Costs:
Deposit (£25,000) | Stamp Duty*: £3,000 (England/Investor) | Legals: £1,500 | Fees: £1,500 (e.g. mortgage valuation / broker** / survey etc) | Contingency: £2,500
Total Purchase Cost: £33,500
Top Tip! A very (VERY) rough estimation of the total one-off purchase costs of (many) investment properties (buying on a 75% mortgage) can be done by simply dividing the Purchase Price by 3. It works better within certain price ranges (due to step-changes in Stamp Duty mostly). Great for 10sec triage, but you NEED to check properly afterwards!
* Stamp Duty is not linear with price, and differs between England and Scotland. Unless you’re very experienced, it’s useful to use a Stamp Duty calculator such as this one.
** Strongly recommend you always use a broker!
Recurring Costs:
Agency Fee (12%) £120pcm | Insurance £50pcm | Mortgage £75,000 x 0.05 / 12 = £312.50pcm
Recurring Costs (tenanted): £482.50
Total Costs Year 1:
£25,000 + £3,000 + £1,500 + £1,500 + £2,500 + £120 x 12 + £50 x 12 + £312.50 x 12
= £33,500 (one-off) + £5,790 (recurring costs over the year)
= £39,290
You’ll notice I add the (small) contingency (2.5% of the Purchase Price in this example for a ready to go, already tenanted BTL) to the spend – so it’s a nice surprise if you don’t spend this, and the numbers would obviously come out better if that is the case. Also, note that costs like the agency fee are only paid if the property is renting, so we are assuming here that the property is tenanted and renting from day 1 – which is possible if you buy already tenanted. Otherwise, you’ll have to account for a little time, say 1 or 2 months, with no rent if you are setting-up or doing some compliance / redecorate. (Warning: this “1st void” period can be unexpectedly stressful for newbie investors!)

5% on a mortgage is a pretty good conservative guide right now in the UK for a 5 year fix in my opinion. Personally, I’d never go for a mortgage with instant fees as that’s an instant cut into your capital – it can be better to pay a slightly higher interest rate. And remember that rents rise, so that cost will be less as time goes on. Just speak with your broker would always be my advice.
Income Year 1:
£1,000pcm x 12 x occupancy (90%) = £10,800
Note: The occupancy factor applied here means that we’d expect the property to be empty 1.2 months of the year. Obviously if it isn’t, then the numbers are better. I don’t put the occupancy factor onto the agency fee (which is only charged if the property lets) because of 2 reasons – firstly it is an added complication for a relatively small cost, and more importantly, allowing for this additional cost both errs on the side of caution AND normally there will be a remarketing fee, which just so happens to be roughly what the agency fee would have been often. So you may as well leave it in as a fixed cost.
So… the ROI!
ROI (year 1) = Income / Total year 1 costs = £10,800 / £39,290 = 27.5%
So this is what could be used to compare all different investments. Did you expect it to be a number like that?
We can expand on this and take a guess as to when we get all of our money out. I’d never do this normally now as I’d use ROCE (later), I’m just showing it here as the roadmap it produces can be enlightening.
In Year 2:
Income: £11,016 (we’ve added a 2% rent rise here)
Costs: £5,790 (mortgage, insurance, agent)
ROI (year 2) = Income (year 1 and 2) / Total costs (year 1 and 2) = £21,816 / £45,080 = 48.3%
So nearly half of all initial purchase costs and recurring costs back at the end of year 2.
In Year 3:
Income: £11,236 (another 2%)
Costs: £5,790 (mortgage, insurance, agent)
ROI (year 3) = Income (total to year 3) / Total costs (total to year 3) = £33,052 / £50,870 = 65.0%
Just remember though, that you’re not really “spending” anything on a recurring basis of course once the property is let, as these costs are covered.
And so on… here’s a graph using this data to give you a better feel for how this happens;

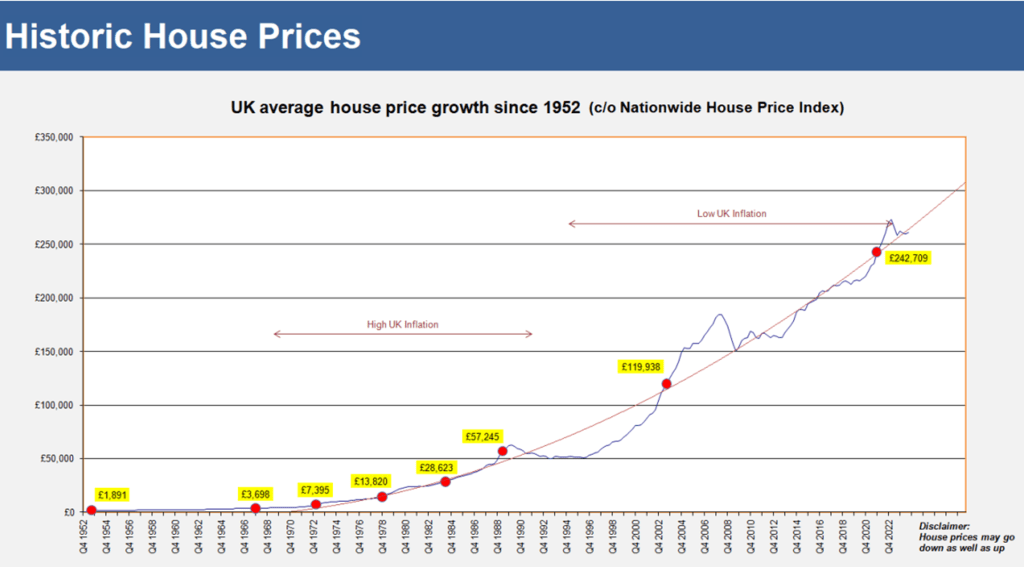
You can see that breakeven is at year 6 – not bad (by the way, this graph line isn’t approaching a flat line – it will keep on growing). This is why property investors are usually skint in the first few years if they are using their own money – it’s basically like sadomasochistic saving for the first few years and just sucks-up everything you have. But it’s an excellent long-term investment. And don’t forget, capital-wise, property DOES double in price on average every few years, as the red dots on the graph below show;
ATTENTION: Housing Cooperatives, Associations, Charities and Councils: We want to help you increase your housing stock and save up to 2 thirds per person housed in the process! Currently, we have units available NOW at 90 day’s notice for lease for up to 6.5years for use as-is, or lightly modified to suit a C3(b) Supported Living purpose – and other areas may be coming soon. On an ongoing basis, we can offer 1 to 10 properties per year, per organisation we work with – depending on your needs. Get in touch here.
So let’s not forget that capital growth happening in the background. So what would that be? In the last 170 years, the average annual growth rate across the whole market has been 2.4% in unadjusted prices – so it’s a good long-term indicator as it averages-out housing crashes – although these still obviously happen, so you need to be wary in the short to medium term. It tends to be a little too conservative in the very short-term (like below), but that’s a good thing in my opinion. So that’s;
Year 0: £100,000
Year 1: £102,400
Year 2: £104,858
Year 3: £107,374
Year 4: £109,951
Year 5: £112,590
So assuming we were on that 5 year fix, then at year 5 you could pull a little equity out and go again if you were still growing, or re-mortgage to a lower Loan-to-Value perhaps getting a better rate (depending on what stage you are at in life and your risk appetite). At some point, you can stop increasing the mortgage, and let time, inflation, capital price increases and rental growth help you pay off the debt at a later date. To use an extreme example, imagine someone bought an average property in 1984 for £28,000 with a 75% mortgage (£21,000). That would have felt like a hell of alot of money for the average person in 1984. But if they’d rented it out and kept re-mortgaging at the same amount (£21,000), they’d now have a £21,000 mortgage on the same average property, now valued at £250,000. That’s only an 8.4% mortgage – so they will be getting the best interest rates now, and if they wanted, could probably pay it off fairly quickly with the rent. Well, that was 40 years ago, so what do you think if you bought the average property today (£250,000) with a 75% mortgage (£187,500) and waited another 40 years while renting it out? Inflation, rent rises and property capital increases would render most likely the same result to your debt…
Inflation will of course reduces the “drama” of those historic house-prices (obviously a house in 1952 didn’t cost £1,891 in today’s money – it cost that in 1952 money – and that money has lost alot of value since then due to inflation). At an inflation rate of 3.6%, any money just sat around roughly loses half of it’s buying power every 20 years – meaning you can buy half as much with it. The situation is often much better if you invest in property. In other words, £100, after waiting 20 years, would only be able to buy about 50% of equivalent stuff that it could have today.
UTILITY OF THE WEEK. ReStream Audio Transcriber. This handy free little tool converts spoken audio to text. Really useful if you sometimes have to make long audio notes out and about, or if you prefer reading and want to covert a non-transcribed podcast into text. I’ve already been using it to generate scripts, and it’s about 95% accurate. There are other tools on the site as well, such as tools to generate scripts for videos.
A better way to think about the investment (particularly after year 1) is in terms of monthly cashflow when tenanted. So what’s the monthly cashflow for this property?
Cashflow (monthly/tenanted) = Rent – Costs
= £1,000 (rent) – £312.50 (mortgage interest) – £50 (insurance) – £120 (Agent)
= £517.50pcm
So what about Return on Capital Employed? Well for us, this would be your monthly profit against the initial investment. It is probably the most useful, and more investor-friendly measure, whereas ROI is a more “purist” approach that shows the “journey”. Using the above property as an example, the ROCE would be:
Purchase Price: £100,000
Initial Purchase Costs: £33,500 (deposit, legals, fees, stamp)
Monthly Profit: £517.50pcm
ROCE (year 1): (£517.50pcm x 12) / £33,500 = 18.5%
This gives a return time of 5.4 years (1 year divided by 18.5%) to get all money back – slightly faster than the 6 years above as it doesn’t account for the 10% voids that the warts-and-all ROI did.
So there we go – 3 numbers for the same property! Confused?
Well in my opinion, the best value to use when comparing investments is the last one – ROCE. It is simply saying “you put in this amount of money at the start (and no more), and you make this in the first year as a percentage of that”. You can also do a simple calculation to work out the return time of the money (1/ROCE).
If you’re not sure what someone is offering, just ask to see the maths and walk through it – as there are lots of interpretations out there of ROI. There is very wide agreement on Gross Yield and quite wide consensus on ROCE.
So I’d stick with Gross Yield for a quick and dirty initial indicator and then ROCE when you’re even slightly serious about a property, as it’s simple, forces you take into account costs, and is a true and steady indication year to year of the performance – whilst also pointing to when you’ll see all your money back (not taking into account any capital price bonuses of course).
So in summary, this property at purchase price £100,000, renting at £1,000, has a Gross Yield of 12%, and, buying it with a 75% mortgage at 5% with costs above as described, would require a £33,500 initial investment to buy, and produce an ROCE of 18.5% – meaning all money out in 5.4 years (not accounting for voids), whilst generating £517.50 in monthly recurring income at today’s rent.
Side-note, if one were to buy the property cash, the calculation would be;
PP: £100,000
Cash-buy: £100,000 | Stamp Duty*: £3,000 (England/Investor) | Legals: £1,500 | Fees: £1,500 (e.g. mortgage valuation / broker** / survey etc) | Contingency: £2,500
Total Costs to Purchase: £108,500
Monthly Profit:
£1,000 (rent) – £50 (insurance) – £120 (Agent) = £830pcm
ROCE = (£830pcm x 12) / £108,500 = 9.2%
So less than half of the return than with a mortgaged purchase, and you’d be waiting 10.9 years (1year / 9.2%) to get your money back out… (and although rents could increase – decreasing the time, costs/repairs could also increase – increasing the time).
So unless one is very wealthy and needs to park alot of money in properties (and there’s nothing wrong with that of course), then it’s almost always better to make use of the leverage effect by using a mortgage.
Who are M2P? Married2Property are a family-run property company that aims to build social good through property.
Words of wisdom – voids (periods where the property is empty) affect the percentages above tremendously as costs mount up fast, whilst income is absent – as it effectively turns everything on its head. You would do well to ensure your strategy has some way to actively minimise voids drastically (or indeed completely). Working with a Property Operator which guarantees rent is one way.
How you can Support: If you know anyone who may be interested in receiving these newsletters, please forward on this newsletter to them. YOUR SUPPORT MEANS ALOT. They can subscribe here:
If you want to see our daily posts, just FOLLOW US on Facebook.
Mon / Tue / Wed / Thu / Fri / Sat / Sun
Song of the Week: 🎶 Driving South – The Stone Roses 🎸
And Finally… I was at a close family Wedding yesterday, playing the Bagpipes and everything (well hopefully I was – I wrote this beforehand!). But they’re always a good reminder that part of finding a good partner is about being completely open and honest and knowing that this is exactly what you both want. Alot like finding a good investor right?

What do M2P do? Married2Property aim to help various Property Operators increase their housing stock – helping to home the homeless as well as other vulnerable groups.
M2P: PRS (PRS038928) (CHECK HERE)
M2P: ICO (ZB527559) (CHECK HERE)
Discover more from Married2Property
Subscribe to get the latest posts sent to your email.

Great Post guys!
LikeLike